PerfView 2
Profile Target
Before we discuss profiling tools and methods, we need a more clear target. What to profile?
- Time
- Most time-consuming module
- Time cost for each line of code
- Time cost for GPU function/CPU function
- Memory/Cache
- Memory consumption
- L1/L2 cache hit ratio
In this chapter, we will go from a simple example. Then we know better about some different profiling tools.
Test Platform
Before our testing and profiling, I will show our test platform.
Nvidia Test Platform
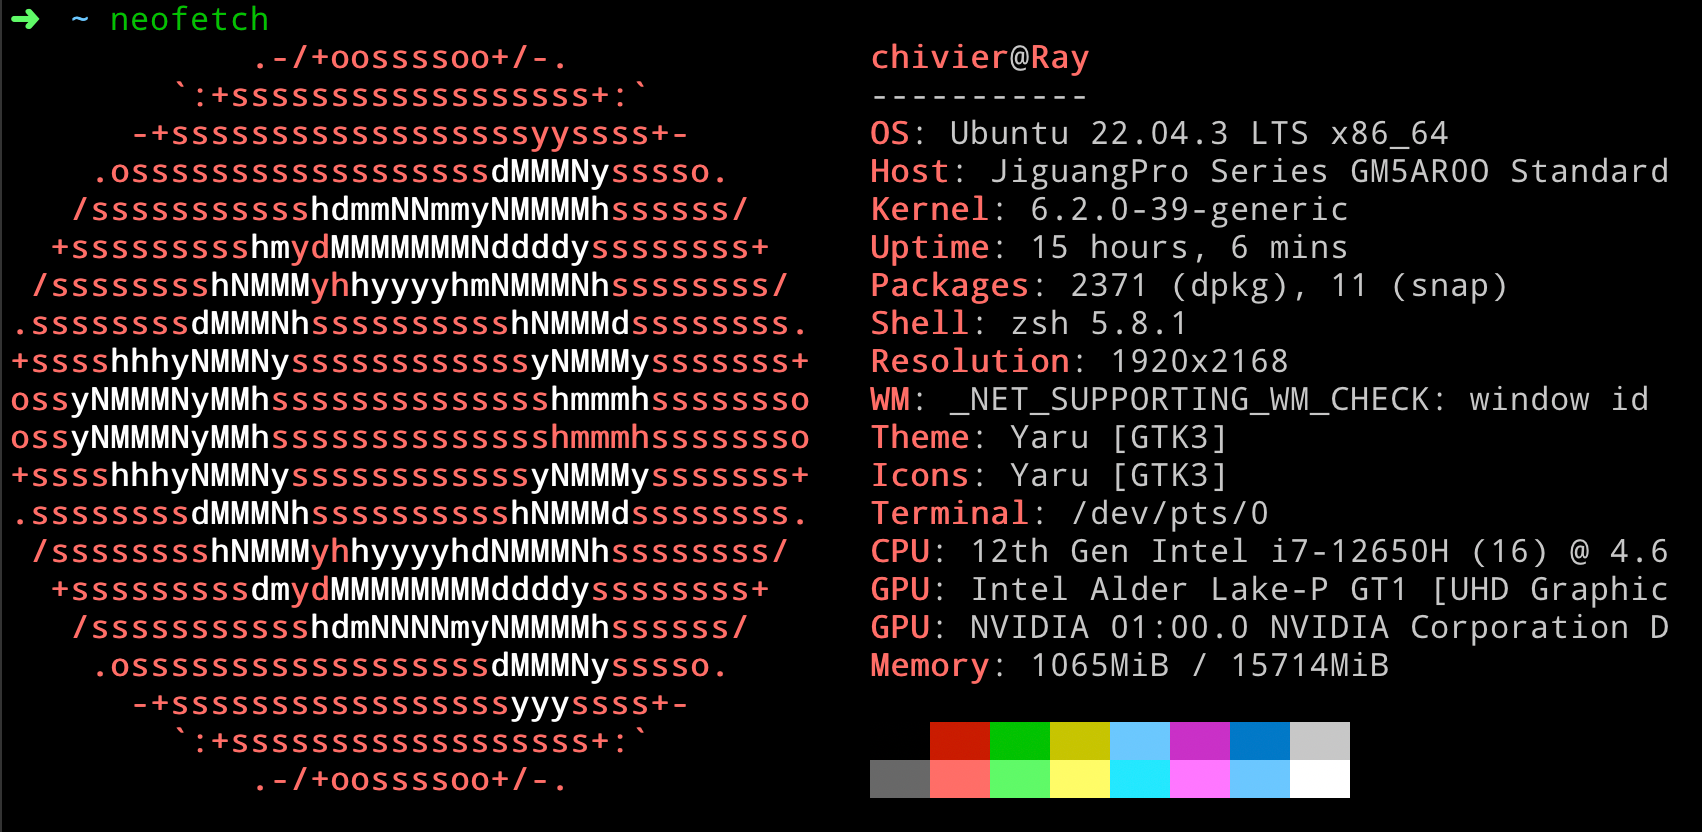
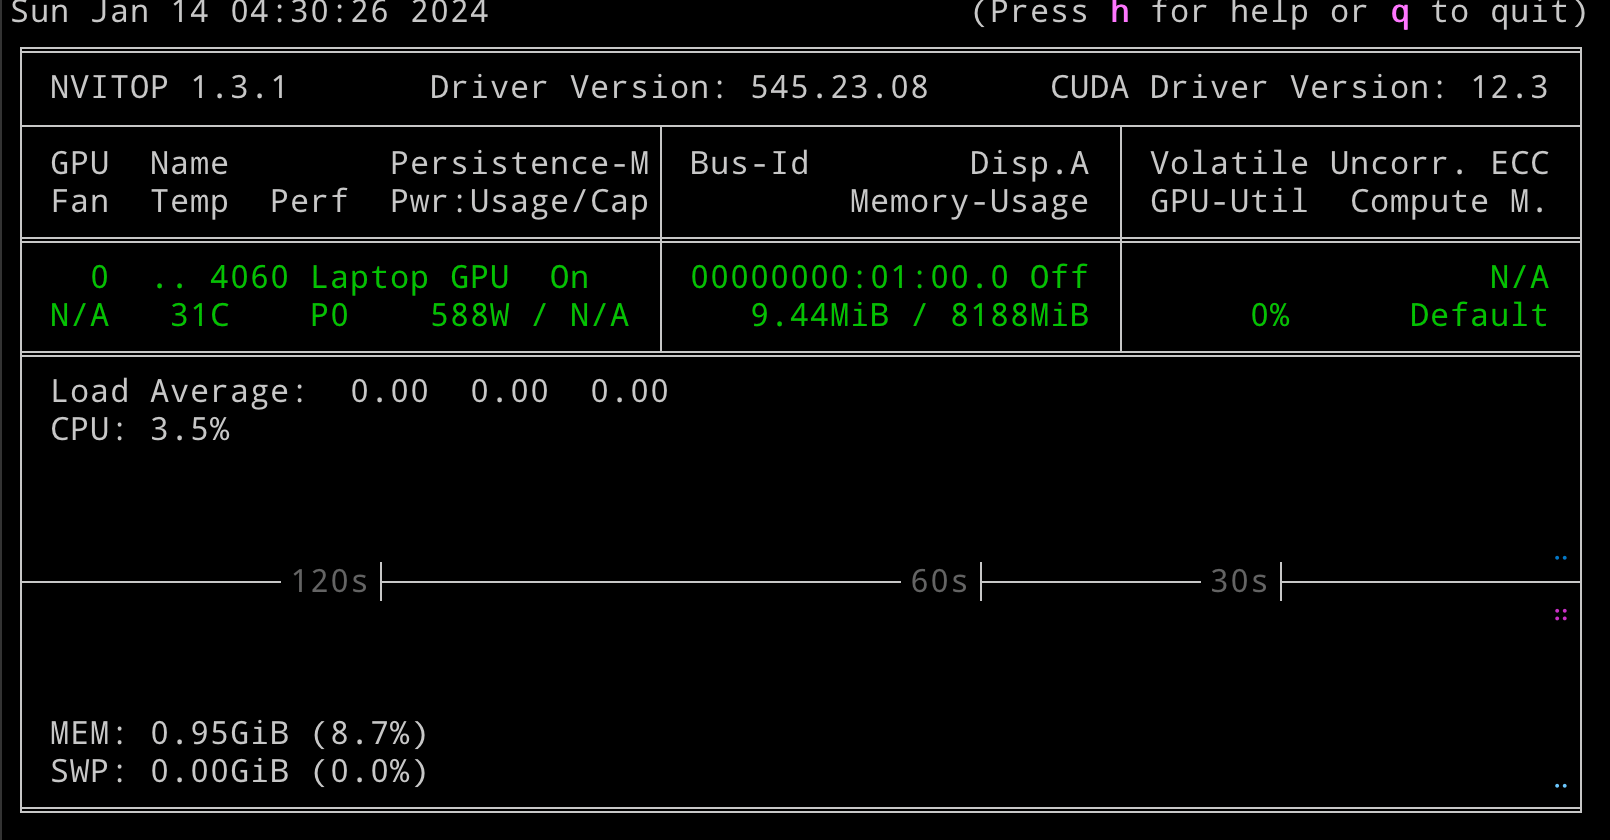
GPU: Nvidia 4060 Laptop GPU, 8GB
Apple Silicon Test Platform
Macbook Air M2, 24GB RAM version

First Glance: Find the Hotspot
Example Link:
pytorch-tutorial/tutorials/01-basics/feedforward_neural_network/main.py at master · yunjey/pytorch-tutorial
Before analyse something, we need an example. Here I select official pytorch tuorial to analyse.
1 | |
After the program is done, you can see results like following images.
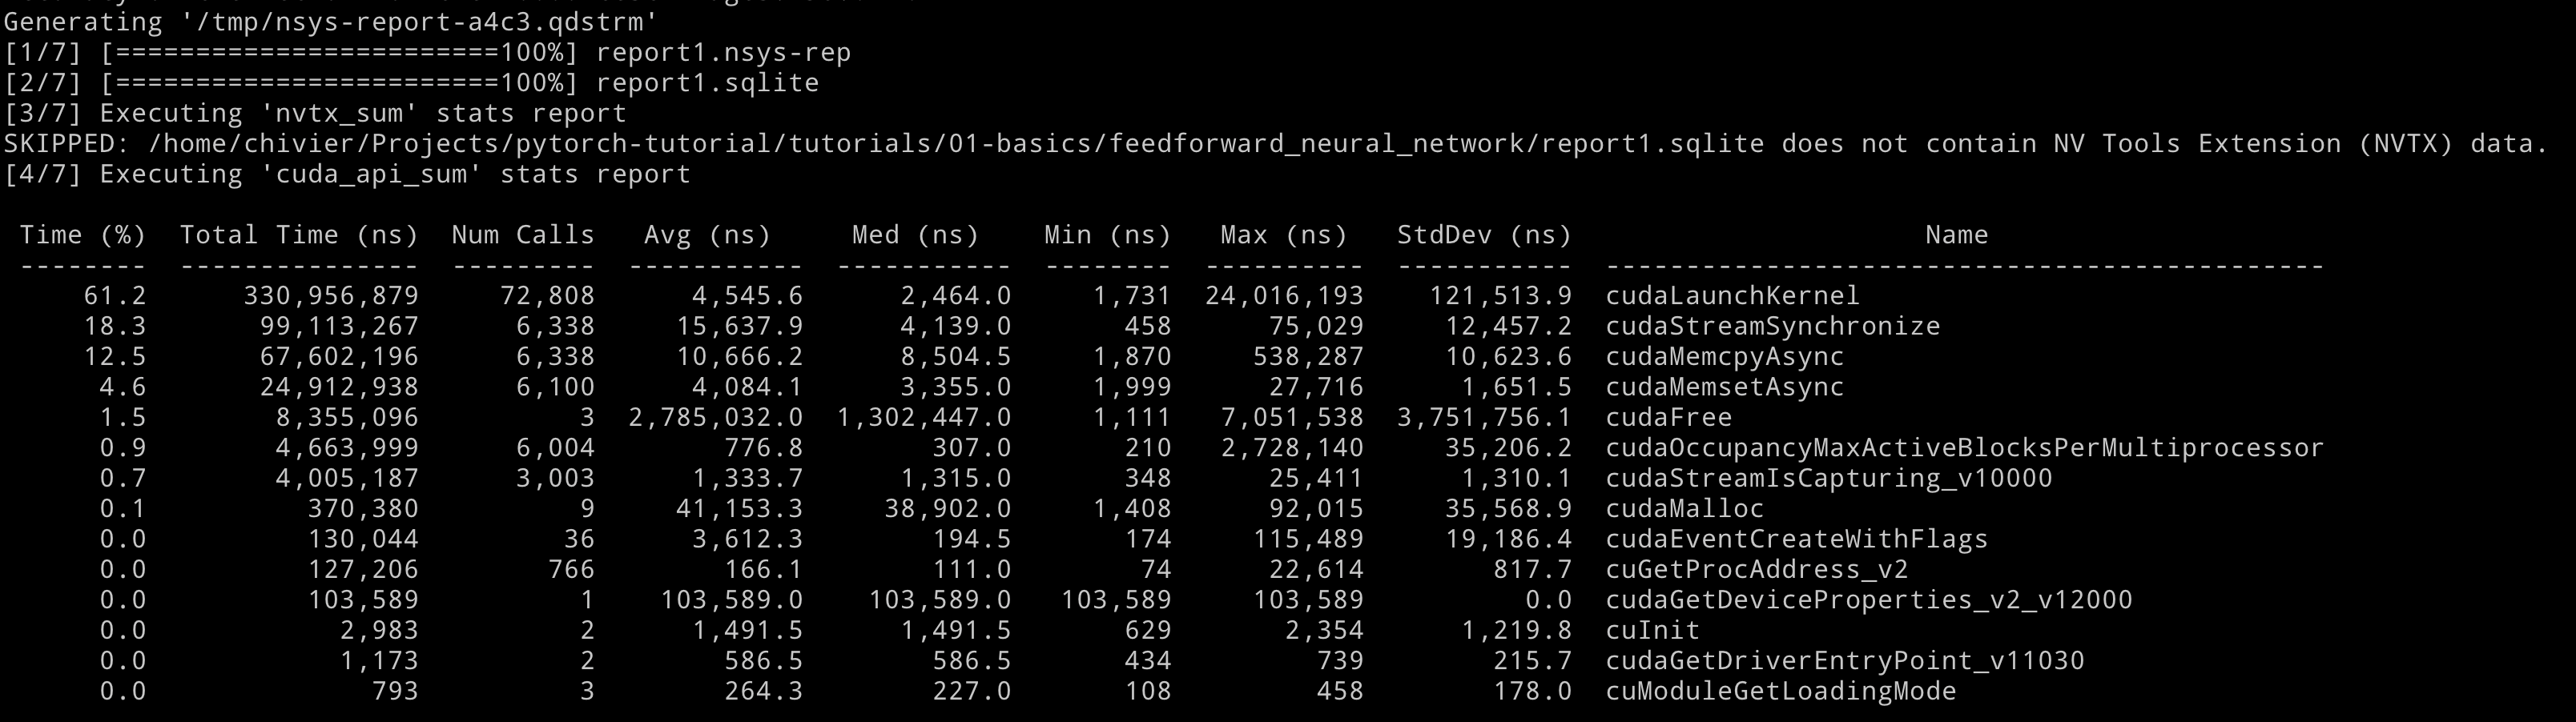
The first image shows all statistics for cuda api. In this part, we can get an overview for the most time-consuming cuda api.
And then, it comes to our second image:
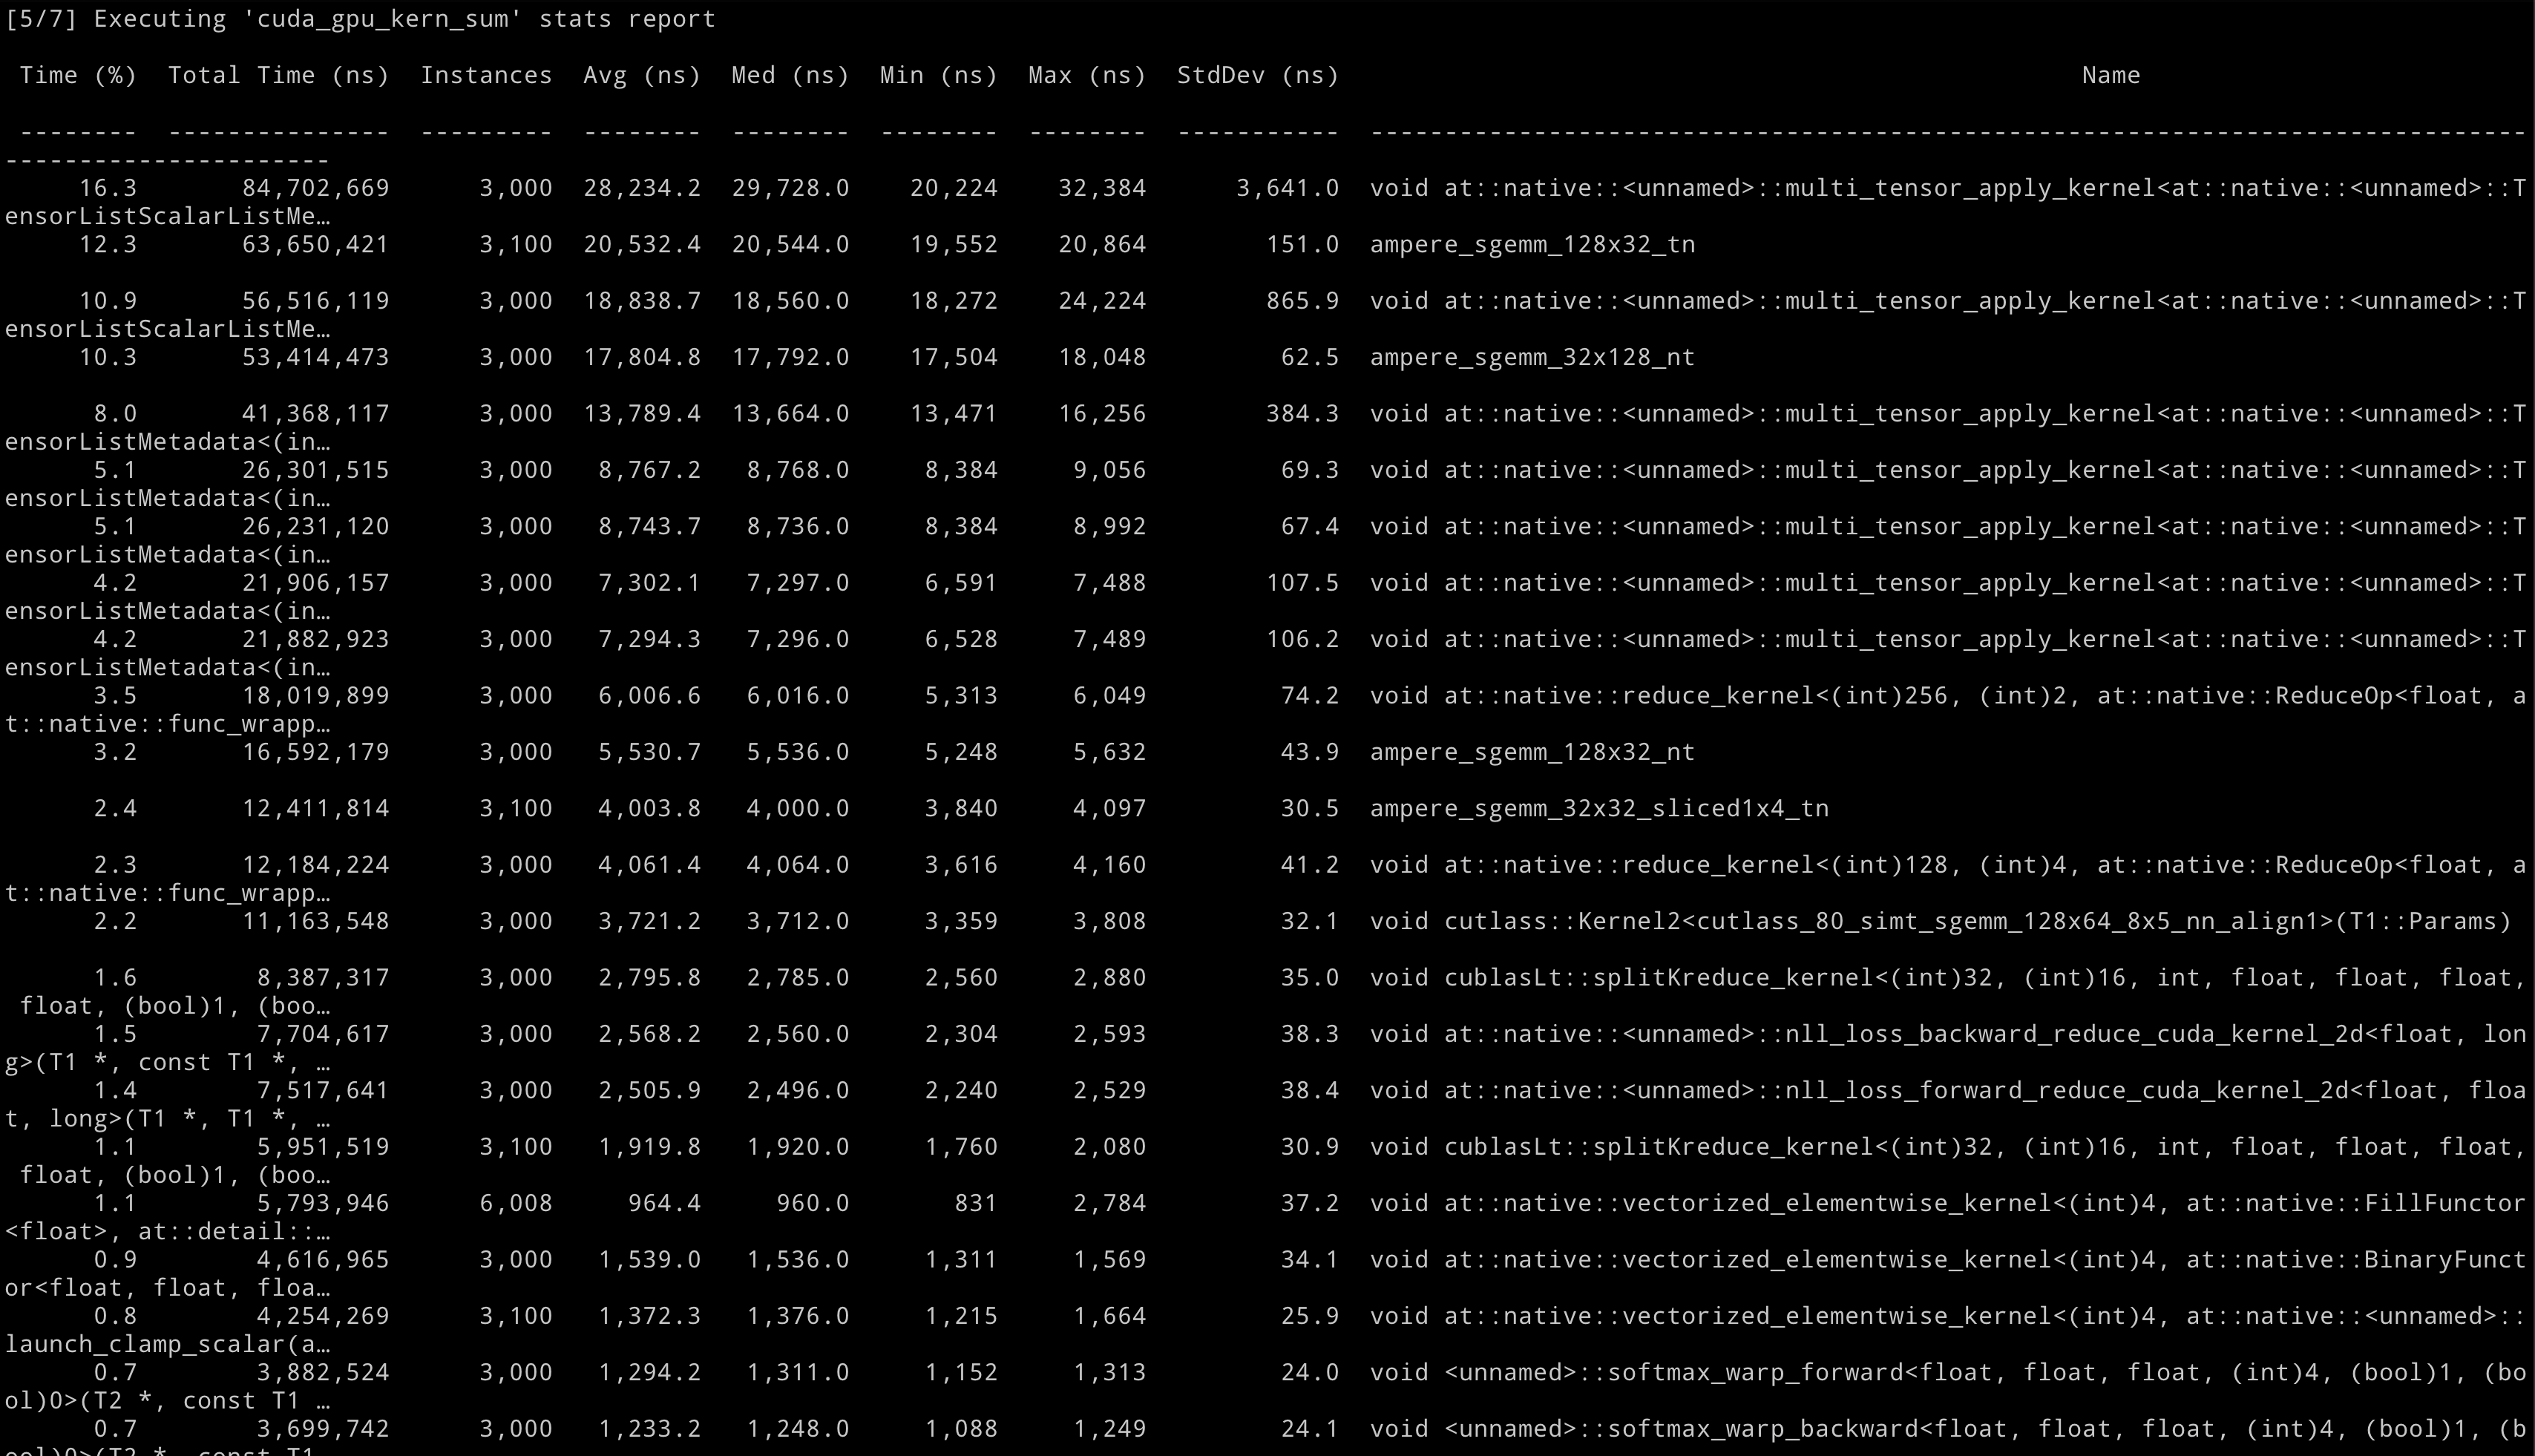
The second image details the execution time for each CUDA kernel. It’s important to distinguish this from the data in the first image and understand how they relate.
The cuda_api_sum section lists the performance of CUDA API calls, including cudaLaunchKernel, cudaStreamSynchronize, cudaMemcpyAsync, and cudaMemsetAsync. It displays the duration of these calls, their frequency, and metrics such as average and standard deviation.
Conversely, the cuda_gpu_kern_sum section focuses on the execution details of GPU kernels. It shows how long each kernel runs, how often it’s called, and similar metrics to those in the cuda_api_sum.
Although separate, the two sections are related. The cuda_gpu_kern_sum entries are for GPU activities, which start with API calls like cudaLaunchKernel recorded in the cuda_api_sum. The latter includes the time to prepare and initiate a kernel, while the former shows the kernel’s actual runtime on the GPU.
In essence, cuda_gpu_kern_sum provides specifics on GPU kernel performance, and the cuda_api_sum logs the API calls launching them.
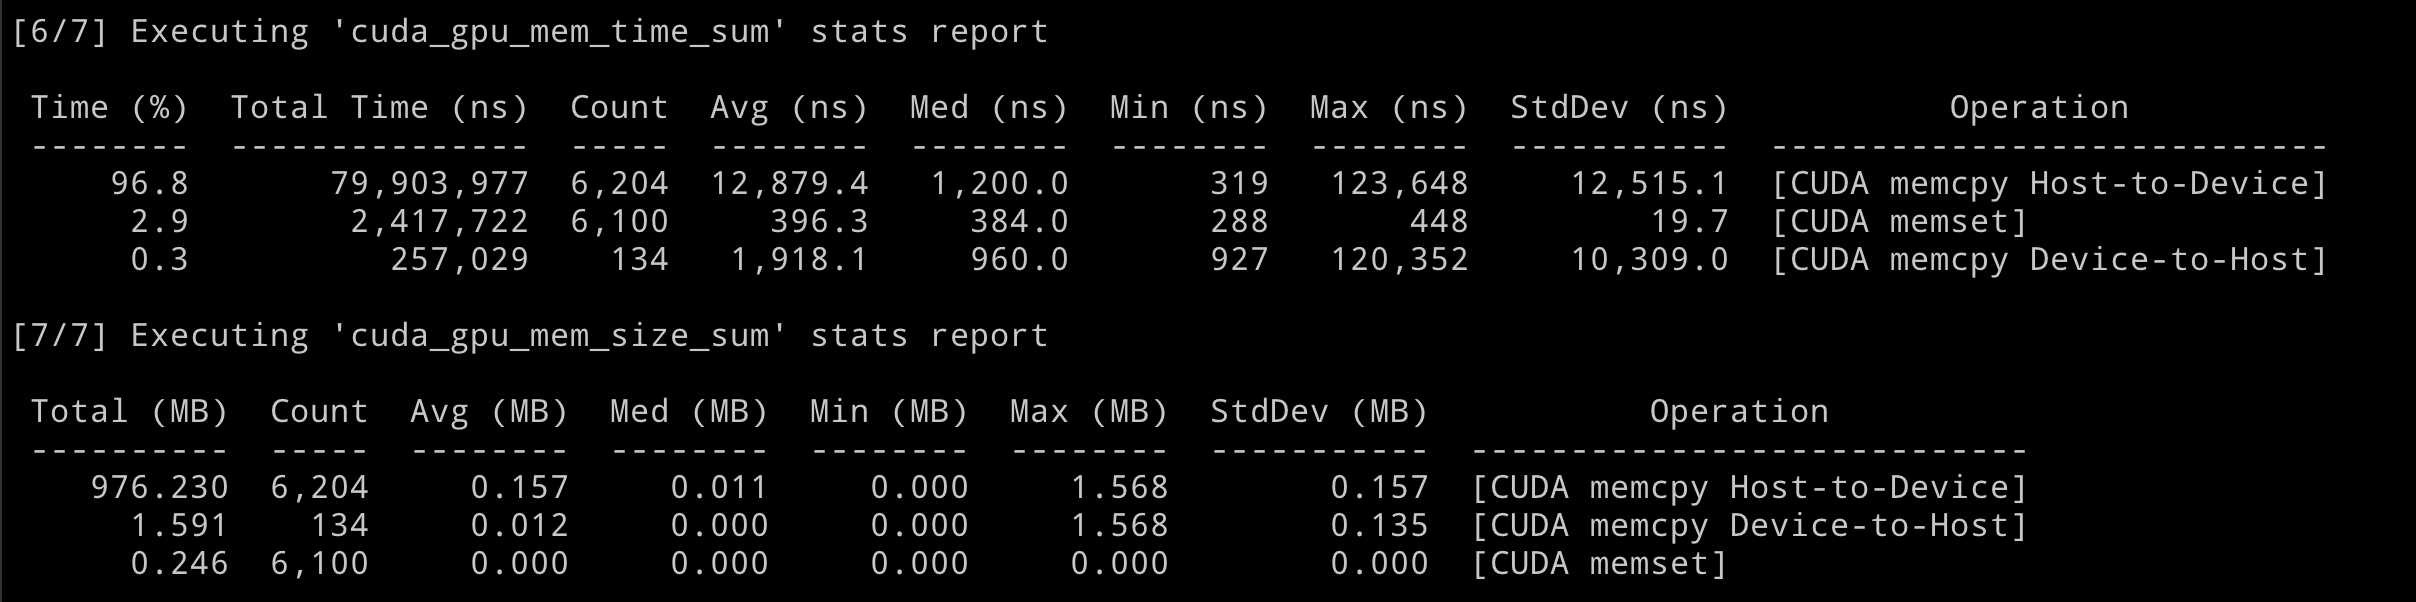
Finally, the last part. This part is about the memory behavior, you can find the time consumption and data amount for data movement between CPU & GPU. This is very important for us to check if IO in our program is a bottleneck.
But, is this profile enough for us to fully understand the program behaviour on GPU?
Definitely not. This preliminary outcome solely assists in identifying the most time-intensive kernel within the GPU. It is worth acknowledging that optimizing performance for the most time-consuming kernel in the program can effectively reduce the overall execution time. However, kernel optimization is a highly specialized and challenging task. To gain a comprehensive understanding, we must utilize nsight compute[1], which provides detailed insights such as register arrangement and cache hit ratio. It is crucial to develop distinct strategies for enhancing performance based on the specific hardware in use. Even within a single company like NVIDIA, different GPUs possess varying architectures.
To gain better performance in a more general method, we have many other options besides focusing on one GPU kernel.
Go A Little Bit Deeper
The Nsight System profile, specifically the nsys tool mentioned earlier, offers an additional method for presenting statistical results in a timeline format. To access these results, it is necessary to download the corresponding files from the server. Once downloaded, the statistical file can be opened within the Nsight System GUI tool.
The result seems the same as we just seen in GUI, but if we zoom in, we can find something different.

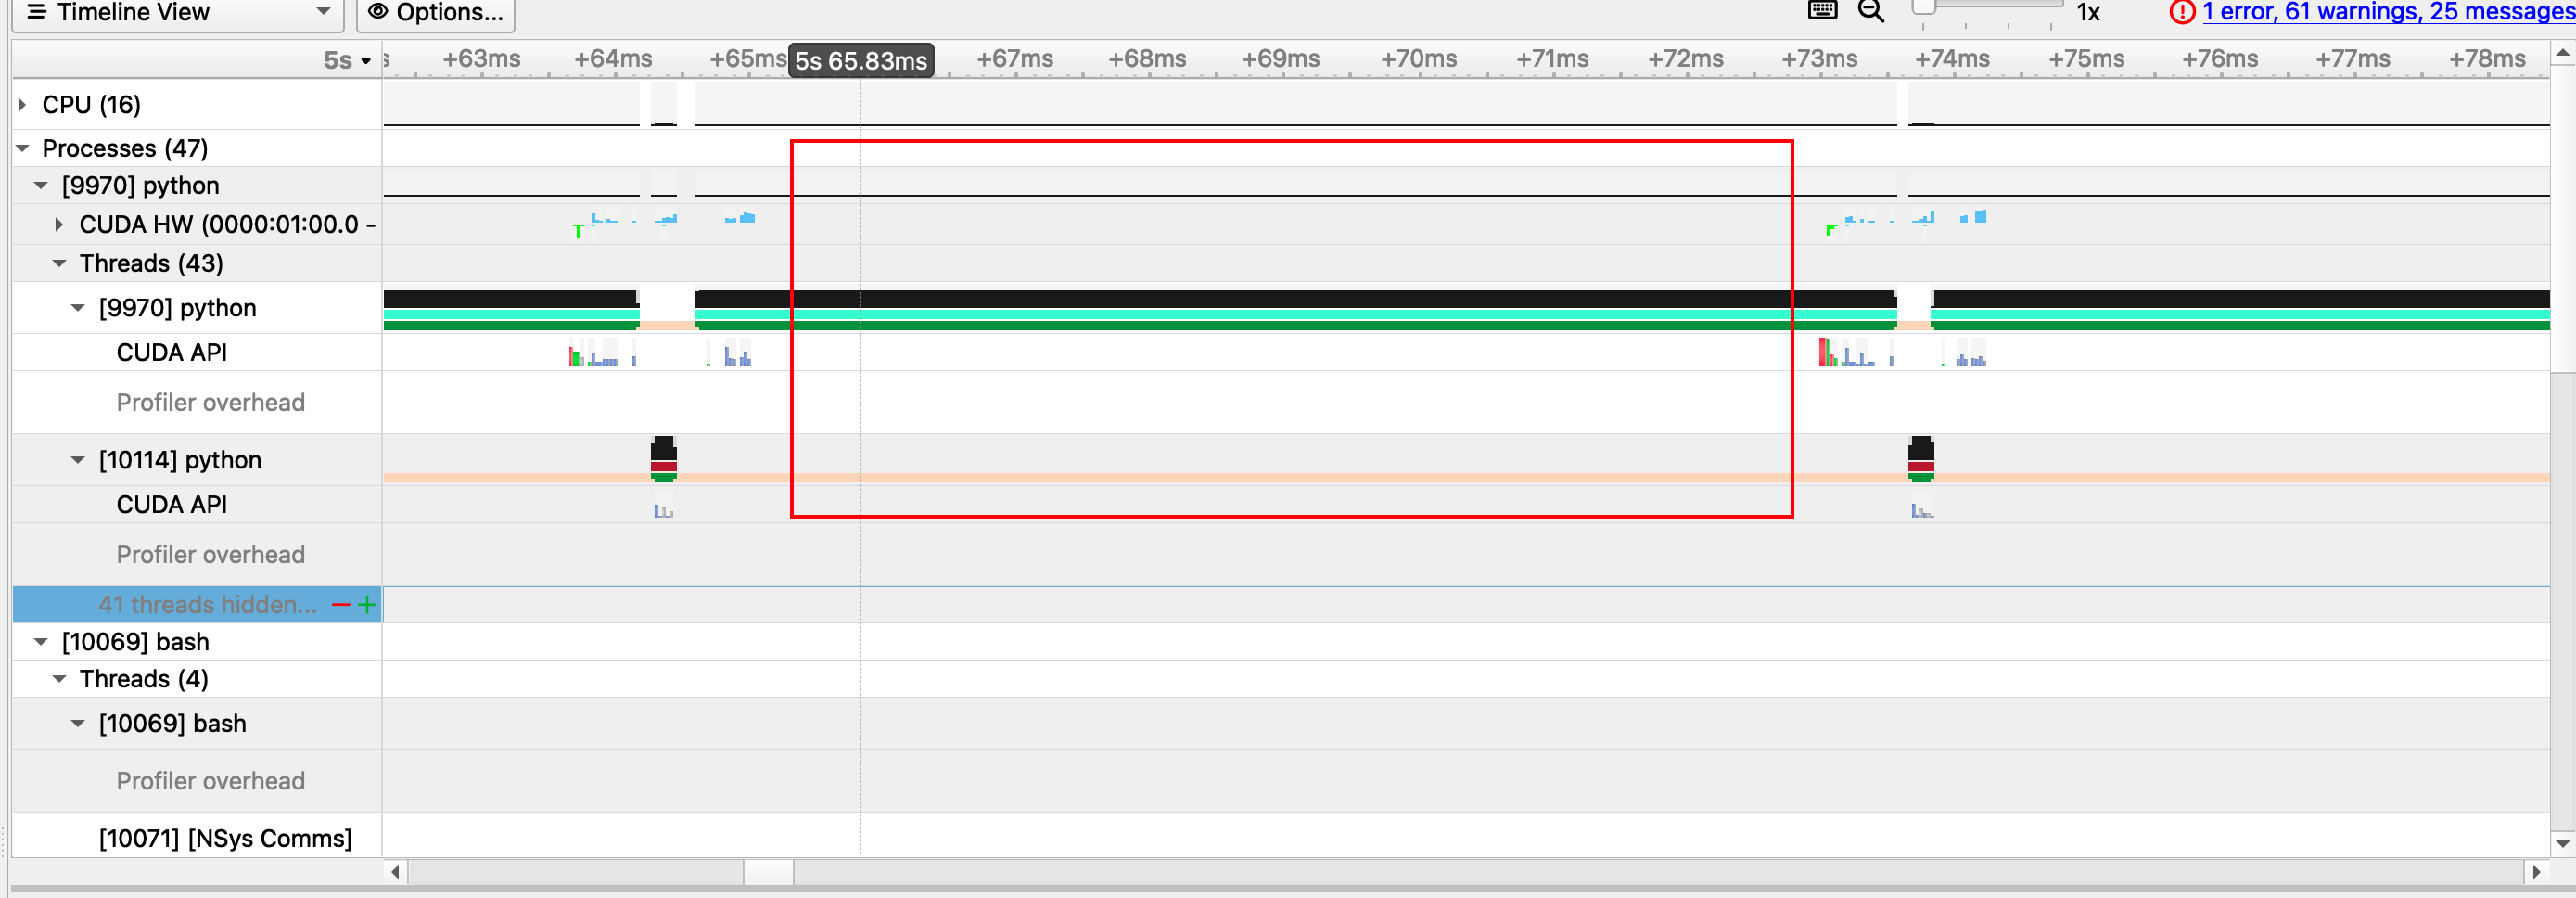
Upon closer examination, it becomes apparent that there is a significant amount of idle time on our device. The question arises: what is the cause of this idle time, and is it possible to prevent it? In the subsequent chapters, I will delve into this matter in further detail.
Another View from Torch
When utilizing the torch framework, it is important to remember that there is an alternative method available for measuring the model. By defining a model using the torch API, it becomes possible to directly fetch the profile by measuring the relevant APIs. Fortunately, PyTorch has already implemented a built-in method to facilitate this process.
1 | |
In the forward pass, prior to invoking our torch model, it is possible to include a profile tag at this juncture. Presented below are some excerpts from the profile outcomes:
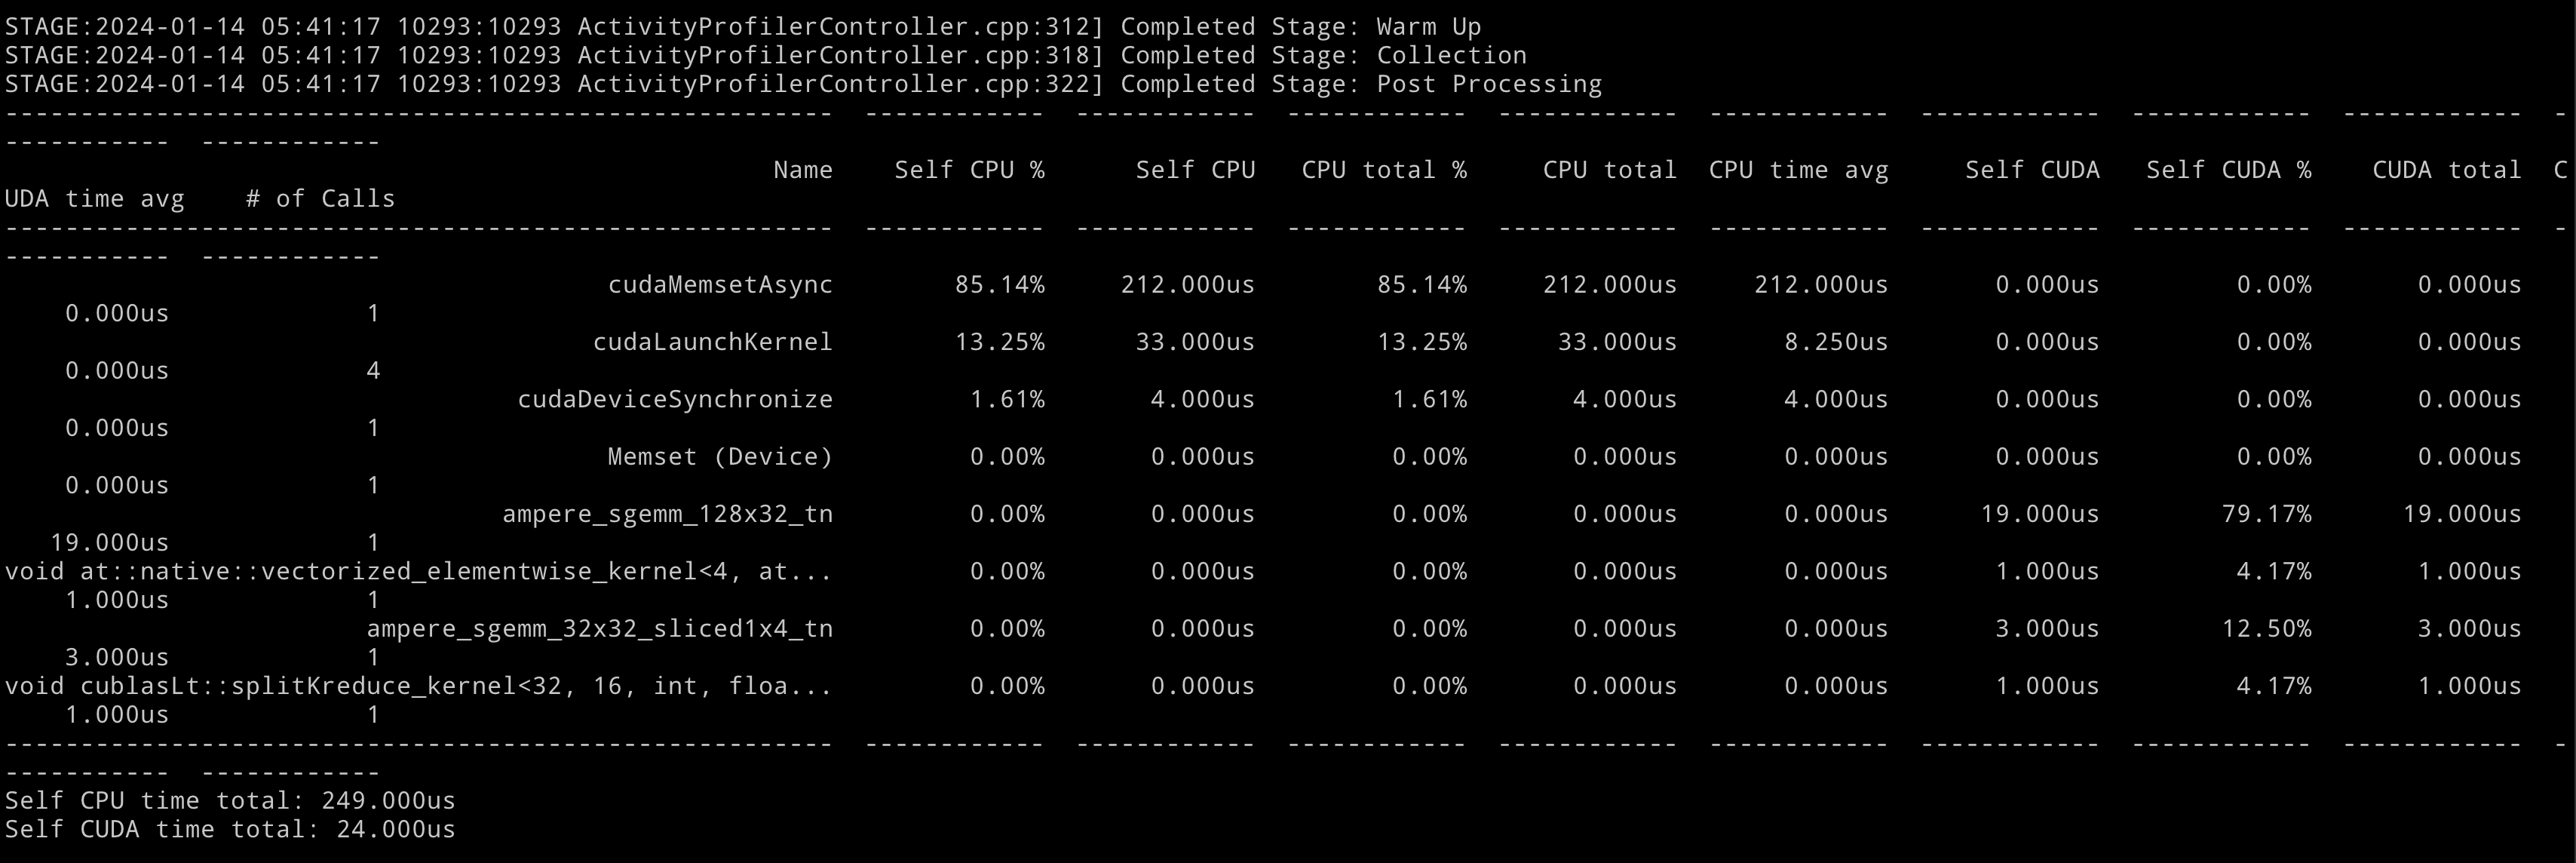
Pytorch also has API for generating memory profile and framegraph profile, more examples are listed in Further Reading Part.
Modern View: Measure Line by Line
Ah, I guess you might have interest to read Perfview Series now. Before ending this chapter, I have one more interesting tool to introduce to you, this tool comes from OSDI 23’s best paper osdi23-berger.pdf
Simple to install, also simple to use.
1 | |
The result is stored in profile.html and profile.json by default. We can download them to our local computer to check them.

We can see that the CPU usage, GPU usage and memory consumption are measured line by line.
Further Reading
- Nsight-Compute Document: Nsight Compute : Nsight Compute Documentation
- Nsight-System Document: User Guide — nsight-systems 2023.4.1 documentation
- Torch Profile Document: PyTorch Profiler — PyTorch Tutorials 2.2.0+cu121 documentation
Reference